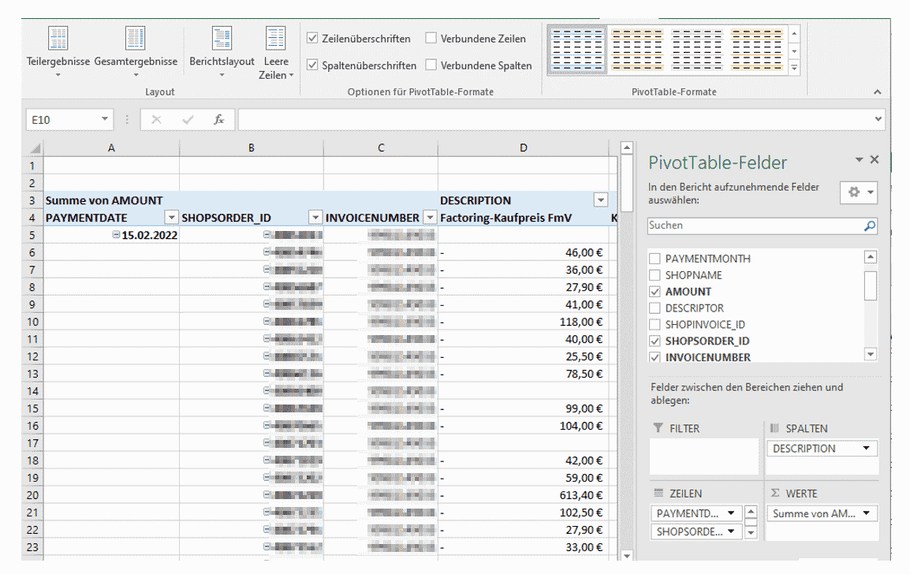
How to create Pivot table from CSV settlement report imported in Excel
Ratepay-provided Pivot templates
Download: Ratepay_pivot_v1.xlsx
Download: Ratepay_pivot_v2.xlsx
Download: Ratepay_pivot_v3.xlsx
Download: Ratepay_pivot_v4.xlsx
Included columns per version
| v1 | v2 | v3 | v4 |
|---|---|---|---|
| SHOP_ID | SHOP_ID | SHOP_ID | SHOP_ID |
| PAYMENTDATE | PAYMENTDATE | PAYMENTDATE | PAYMENTDATE |
| PAYMENTMONTH | PAYMENTMONTH | PAYMENTMONTH | PAYMENTMONTH |
| SHOPNAME | SHOPNAME | SHOPNAME | SHOPNAME |
| AMOUNT | AMOUNT | AMOUNT | AMOUNT |
| DESCRIPTOR | DESCRIPTOR | DESCRIPTOR | DESCRIPTOR |
| SHOPINVOICE_ID | SHOPINVOICE_ID | SHOPINVOICE_ID | SHOPINVOICE_ID |
| SHOPSORDER_ID | SHOPSORDER_ID | SHOPSORDER_ID | SHOPSORDER_ID |
| INVOICENUMBER | INVOICENUMBER | INVOICENUMBER | INVOICENUMBER |
| DESCRIPTION | DESCRIPTION | DESCRIPTION | DESCRIPTION |
| FEETYPE | FEETYPE | FEETYPE | FEETYPE |
| ORDERDATE | ORDERDATE | ORDERDATE | ORDERDATE |
| SENTDATE | SENTDATE | SENTDATE | SENTDATE |
| TRANSACTION_ID | TRANSACTION_ID | TRANSACTION_ID | TRANSACTION_ID |
| CUSTOMERGROUP | CUSTOMERGROUP | DEALER_ID | |
| KNOWNCUSTOMER | KNOWNCUSTOMER | ||
| PRODUCT | PRODUCT | ||
| REFERENCEIDACCOUNTING | REFERENCE_ID_ACCOUNTING | ||
| CHARGEBACK_REASON |
How to use the template provided by Ratepay
- Select the Ratepay-provided Excel template that fits to your version of CSV settlement report
- Import your CSV settlement report as per our Guide
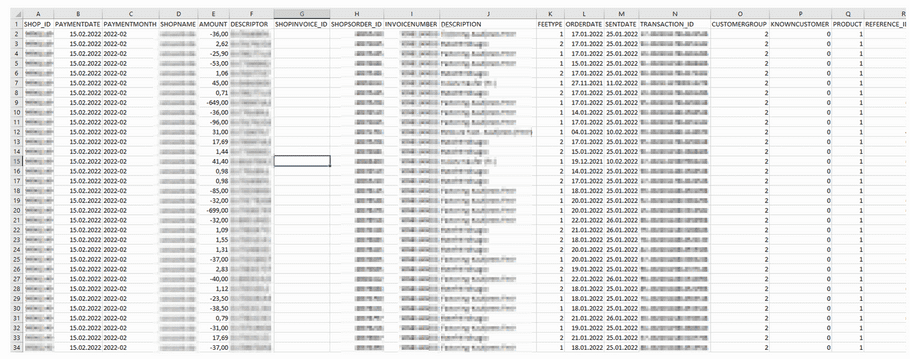
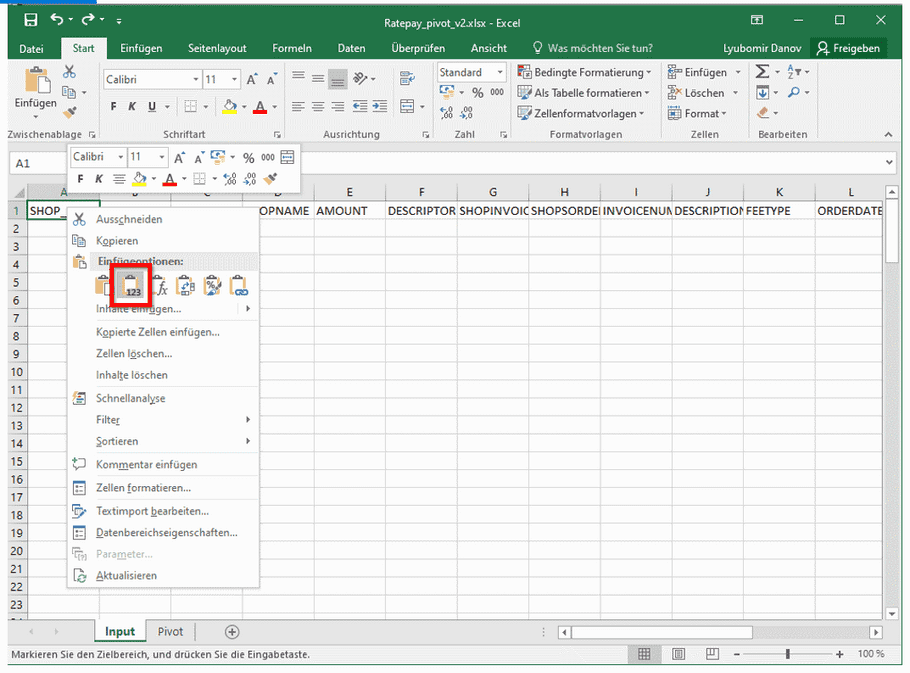
- Copy the imported content into the "Input" sheet of our template. Use paste as "Values" to not corrupt the data
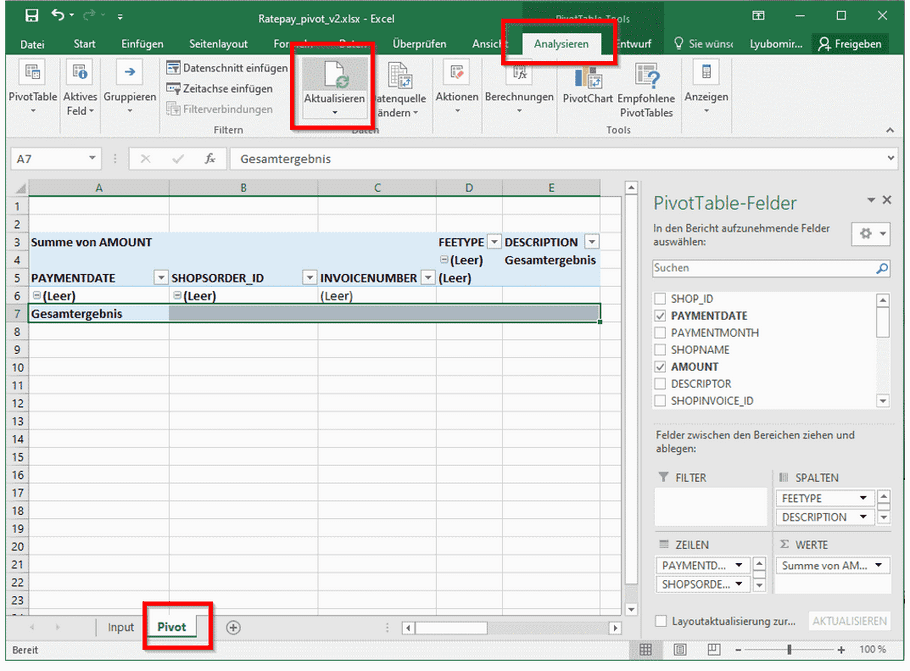
- In the "Pivot" sheet under "Analyze", press "Refresh"
- The data is now visualized in the Pivot table

How to create a Pivot table from a CSV settlement report imported in Excel
Problem: When the CSV settlement report is imported into Excel it does not show information on transaction level
Solution: Use the integrated Pivot functionality of Excel to adjust the report to your needs
.png)
- In the sheet containing the imported settlement report, mark all data by pressing the Select All button (or use the keyboard shortcut CTRL + A)
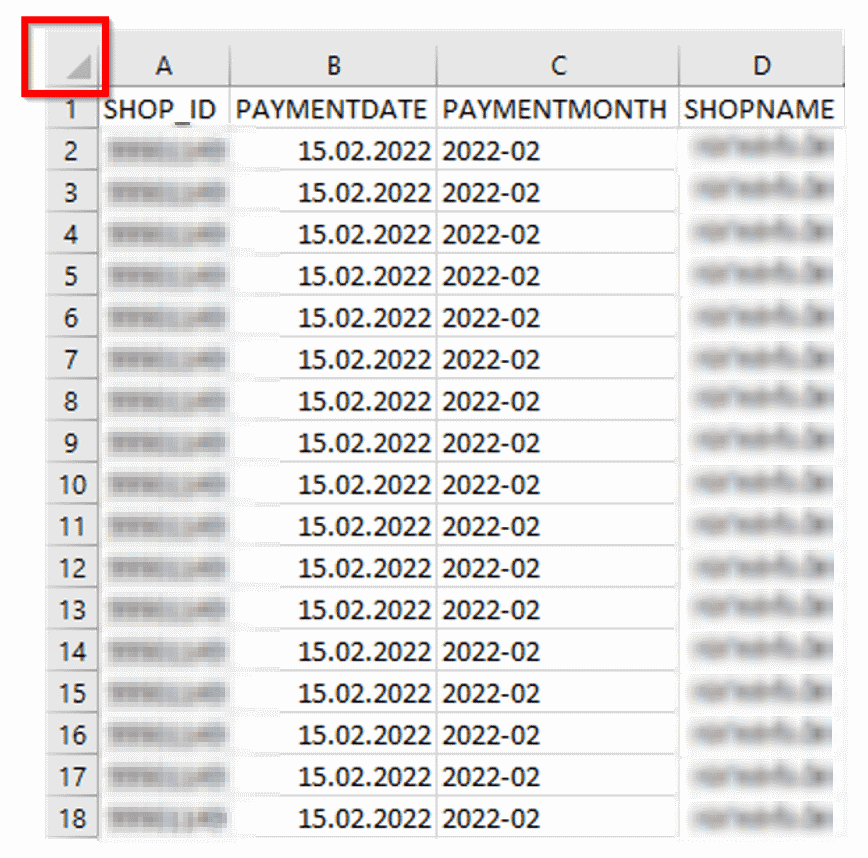
- Go to the Insert tab and from the Tables group select PivotTable
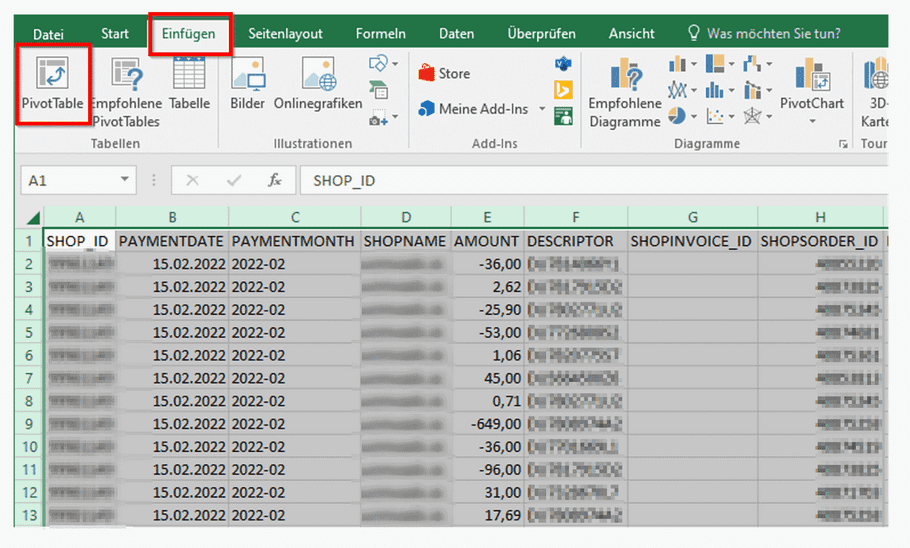
- Select "OK"
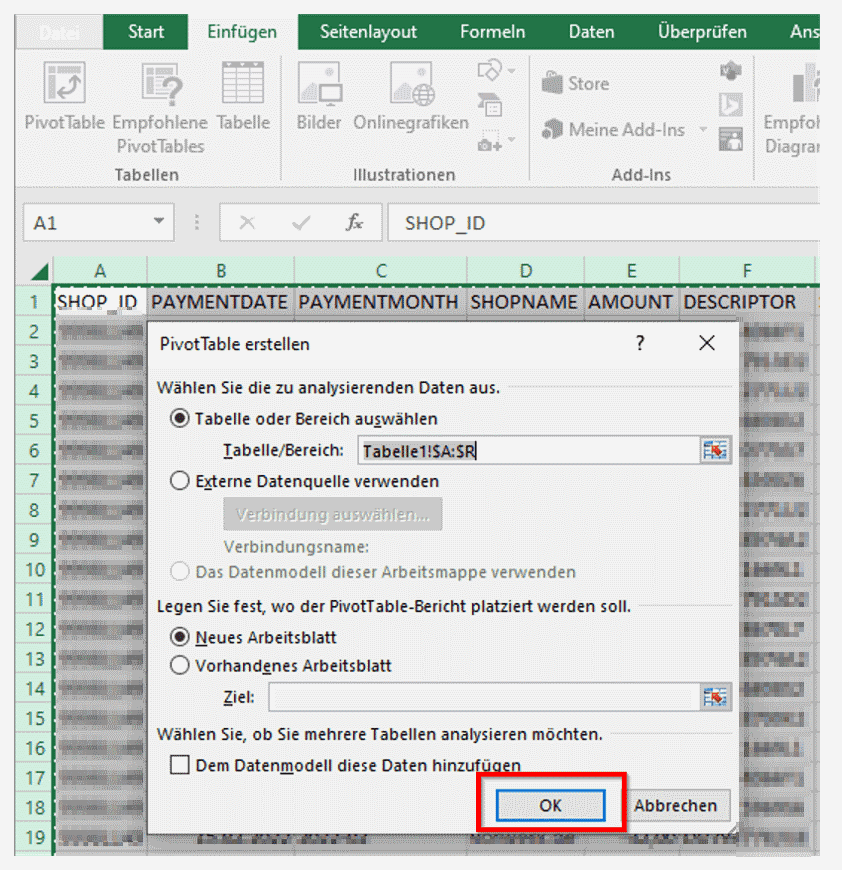
- Adjust the Pivot table to fit your needs. Take a loot at our tips below or use one of our templates at the top of the page
Tips for adjusting the Pivot table to your needs
Multiple identifiers on same row
When adding multiple identifiers to the "row" PivotTable-Fields part, they are represented hierarchically. To avoid this issue switch the table to Tabular form:
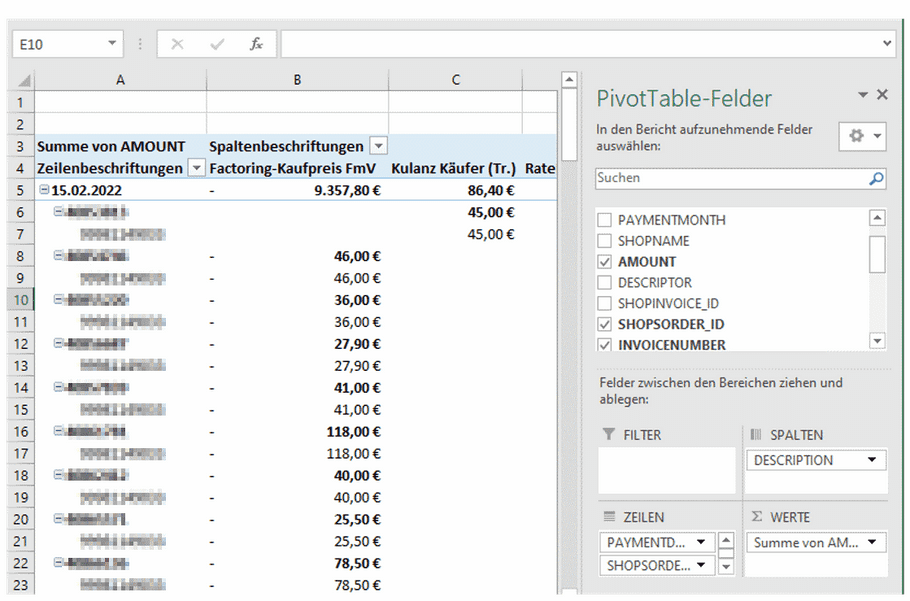
- Click anywhere on the Pivot Table
- On the "Design" tab, in the "Layout" group, click "Report Layout", and click "Show in Tabular Form"
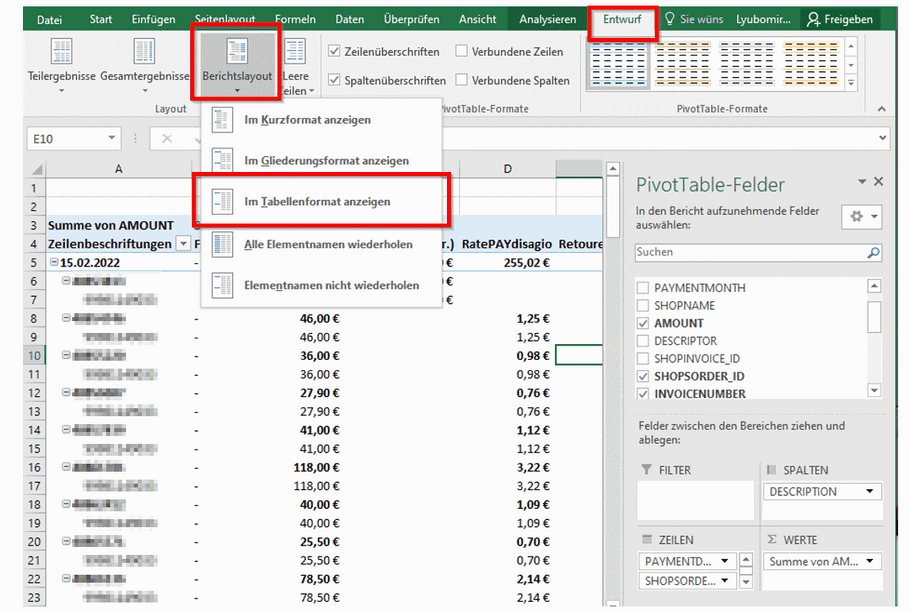
- The data is now represented in a tabular format
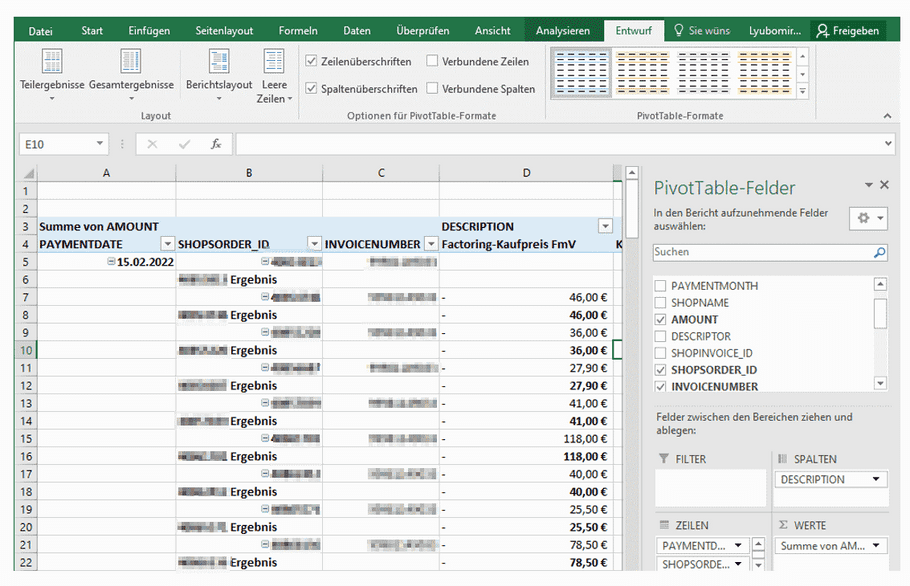
Removing sub-totals
By default, PivotTables calculate and show subtotals. If you want to disable them
- Click anywhere on the Pivot Table
- On the "Design" tab, in the "Layout" group, click "Subtotals", and click "Do not show subtotals"
.png)
- The subtotals are now removed from the Pivot table
